arrow_back View all case studies
Case study
Curriculum analytics
A project to design a tool to measure the engagement of University course modules.
🙋🏻♂️ What were we asked to do?
A Product Owner wanted to explore how we could help Universities to understand which course modules weren’t engaging students as well as they would like.
This was a known problem that Universities shared with us, they had engagement data but didn’t know how best to visualise it, to make it actionable.
🧪 Hypothesis
The Product Owner had an idea they wanted to try. It was a table with a row for each course module and in each of the columns to the right was a stacked bar graph denoting the level of engagement with each measure.
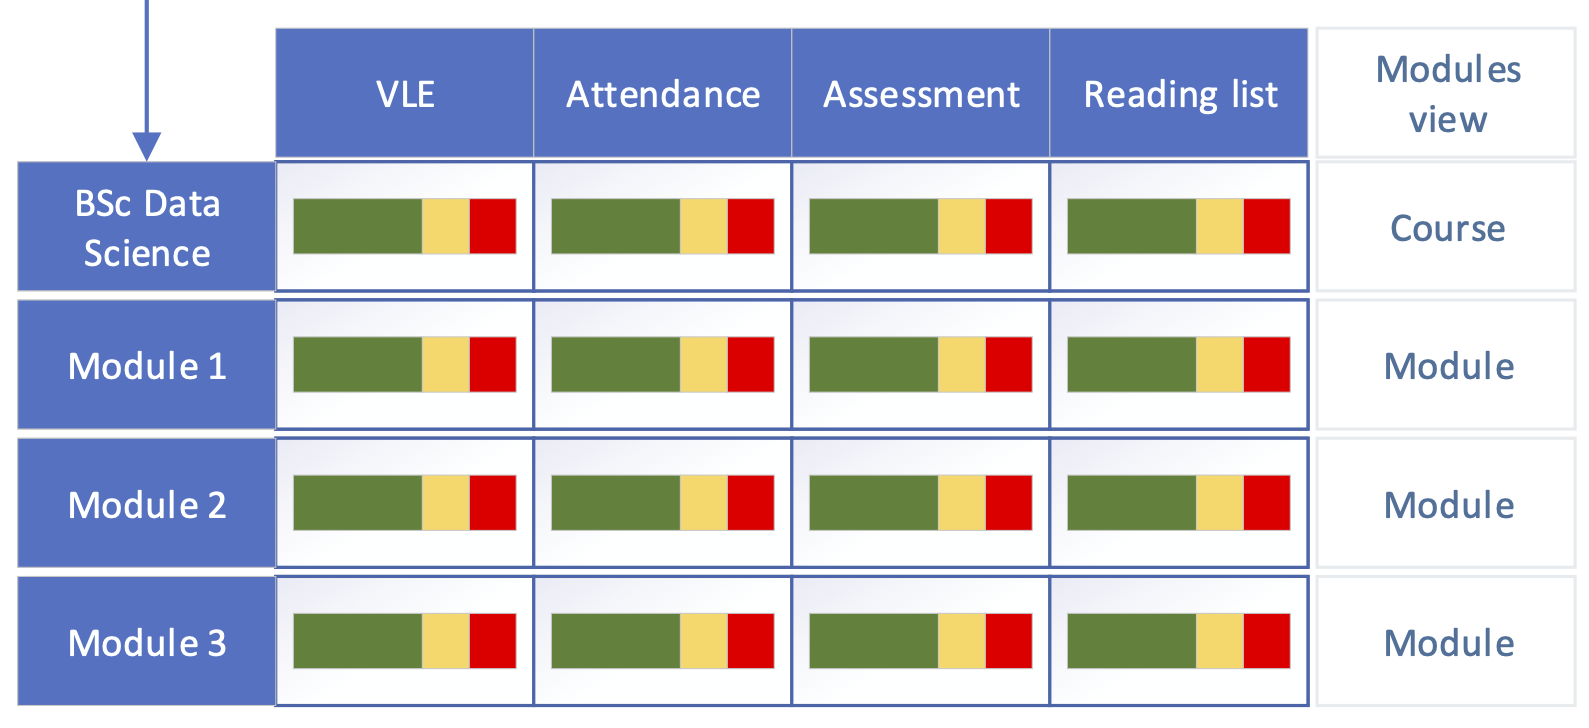
We ran with the idea, making sure throughout that it was their vision we were helping them to explore, rather than something UX were taking ownership of.
🔬 Concept testing
I put together a testable mock-up, which was a low fidelity wireframe with a little more detail than the original concept.
We then carried out some concept testing with select University staff to gauge their reaction to the idea.
There were a number of problems with it - what was the threshold for poor engagement? What do the colours refer to?
There were also accessibility issues - solely using colour to communicate information would make this inaccessible to those with colour blindness. We knew this from the start but it was important for the Product Owner to be part of the journey and see this issue for themselves.
✨ Ideation workshop
To explore other ideas we worked with the Product Owner to produce an in-person design workshop with his development team, including QA testers, scrum master and the head of development.
We provided a skeleton template and tasked participants with coming up with as many ways of displaying engagement data within the columns as possible.
We introduced them to crazy 8 sketching, provided them with the materials they’d need and collectively they came up with over 70 ideas.
✏️ Concept creation
Following the design workshop we selected 3 different ideas to try out, including one that the Product Owner was keen on.
I produced each ideas as a low fidelity wireframe, and we carried out further concept testing with the same participants as the previous round.
This time we were much closer to something that would work well for users. We’d provided more clarity with the visualisations which meant the data was more useful than the initial concept.
This had also helped to show the organisation in a positive light as users could see they were being listened to and things were progressing in the right direction.
🎨 High fidelity design
Feeling more confident with the product idea, we committed to producing a high-fidelity version with a few changes we felt would resolve some of the outstanding issues from the concept testing.
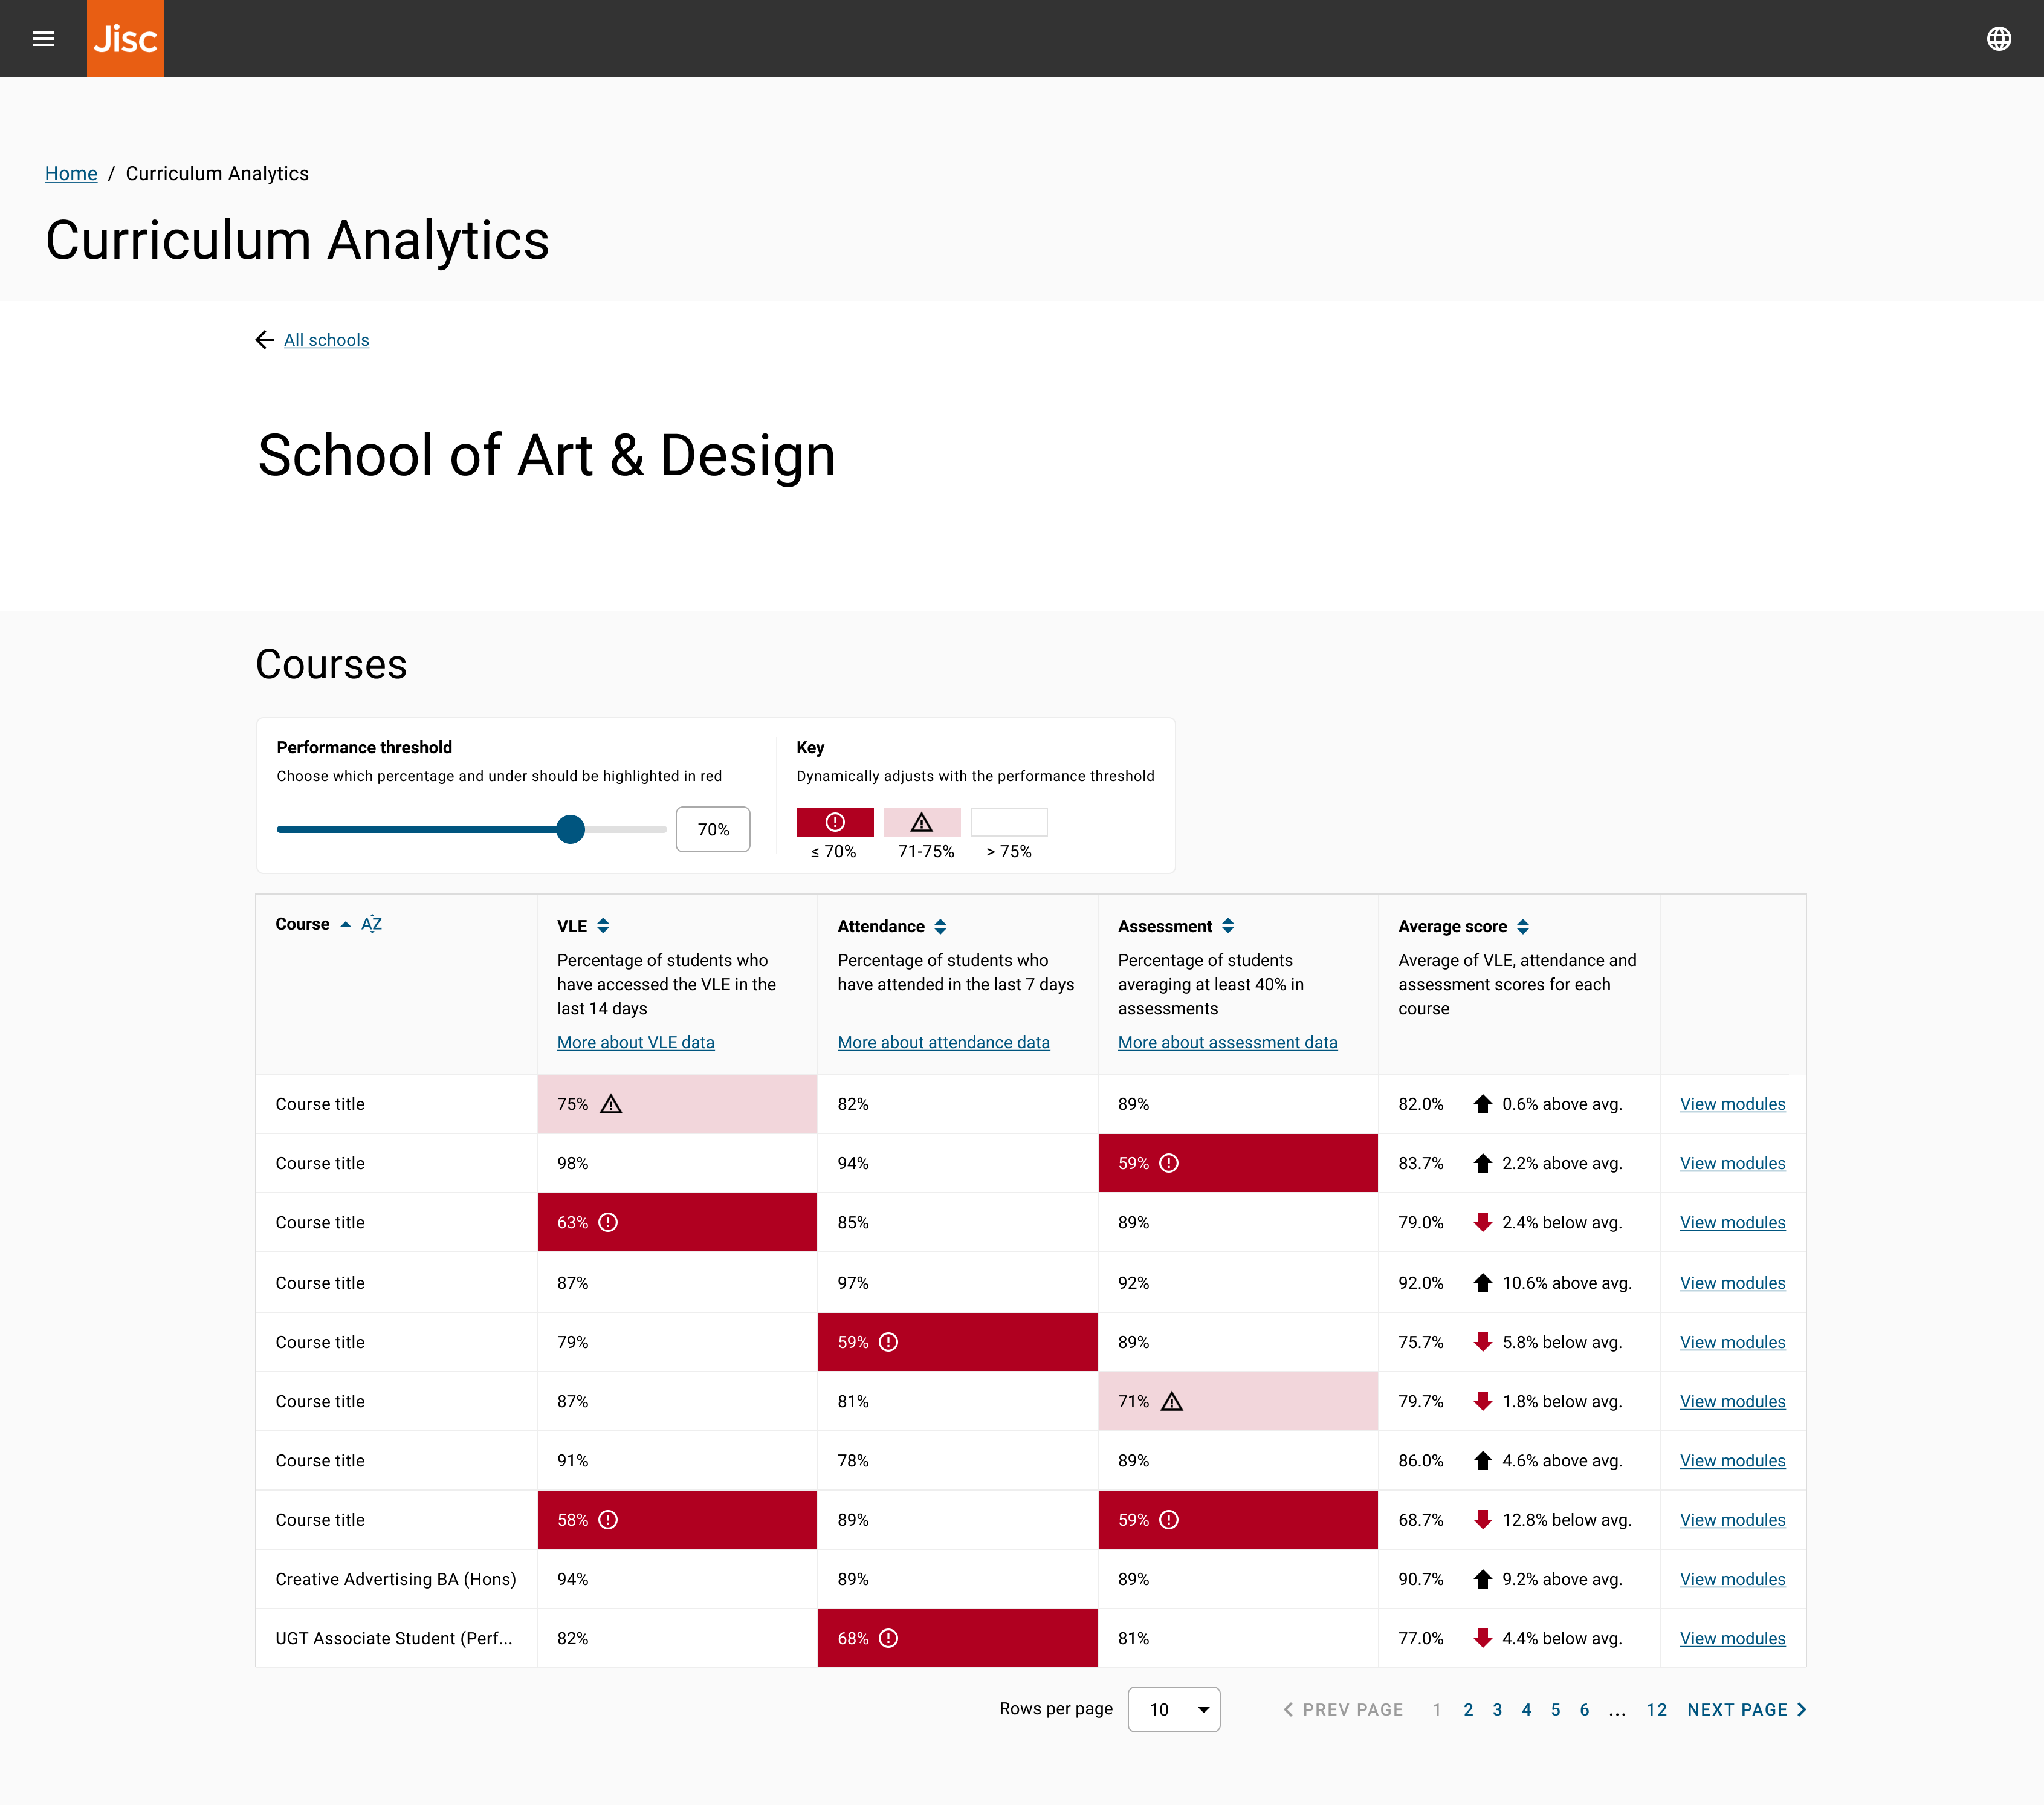
I used an 8 point soft grid throughout, which helped to keep the design consistent. Material Design components were also heavily utilised as at the time this was the UI library the organisation choose to use for most of their products.
One feature we included was a filter to choose the threshold of what constituted poor engagement. Every user we interviewed had a different value in mind so handing the user the control over this felt like an appropriate design choice.
The design was handed to a developer who then turned it into the real product.